AFL 2023: Risers and Sliders
Update 12/09/2023
The AFL 2023 regular season has now concluded, so it’s time for a final look at our pre-season predictions.
Our Power BI data model has been updated, and we’ve once again focused on our significant picks.
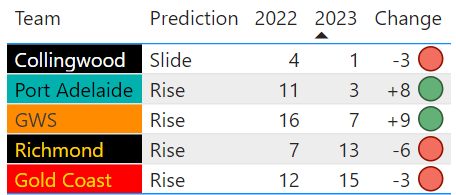
It was a mixed bag of results in the end, with Port Adelaide and GWS massively moving in the direction predicted, but Collingwood, Richmond and Gold Coast going in the opposite direction - albeit to a much smaller extent.
We mentioned in our initial analysis that there were a number of factors we didn’t consider, such as personnel movements, injuries, and overall difficulty of the schedule, all which played a part in the final results.
However, as we mentioned in our previous update, there are a number of ways we can tell this data story, so where we’re going to land for this year is:
2 of our ‘risers’ from outside the top 10 last year, are still alive in the final 6!
Our 5 significant picks moved a net of 5 places in the direction we predicted, or 1 position per team
Update 26/06/2023
After our NRL update a few weeks ago, it’s time to assess our AFL predictions 14 rounds into the 2023 season.
We’ve visualised a table in Power BI, focusing on our significant picks from the pre-season. The table shows each team’s 2022 final ladder position, their current ladder position in 2023, and how that rates versus our pre-season prediction.

Port Adelaide, one of our strong predictions to improve, are sitting 9 places ahead of last year in 2nd place.
Our other strong prediction, Collingwood, ignored our backwards prediction, improving 3 places to 1st place.
Our less strong predictions have produced similarly mixed results - with Gold Coast and GWS rising as expected, and Richmond going against expectation to move backwards.
Similar to the NRL results, how we assess ourselves depends on context, and the story we want to tell with this data.
We could say that 60% of our predictions were correct
We could say that our predictions moved a net total of 5 places in the right direction, or 1 position per team
We’ll let you decide how we’re going for now, and we’ll be back at the end of the season.
Original Article
The cricket summer has come and gone, round 4 of the NRL is about to commence, and the AFL is finally back! Similar to the piece we wrote about the NRL a couple of weeks ago, we’re making some bold, data-driven predictions about the biggest risers and sliders of season 2023.
We have two incredibly strong predictions: Collingwood to slide and Port Adelaide to rise, along with some weaker, yet still statistically significant picks: Richmond, Gold Coast, and GWS to improve.
How we came to that conclusion
If you read our NRL article we won’t go into a full recap - you can see that here.
The quick version though, is that we use a method called ‘Pythagorean expectation’, which calculates how many games a team should have won based on their points scored, and points conceded. A team which wins more is lucky. A team which wins less is unlucky. The statistically significant threshold is a team finishing more than 1.5 wins above, or below their expectation.

In the chart above built in Qlik, we’ve plotted the Expected win % (based on points for and against) against the Actual win % (based on match results) across every season of every team in VFL/AFL history going back to 1897. Each dot represents a distinct season for each club in the competition.
If this was a perfect prediction, we’d expect to see every dot fall right on the red line, with teams winning exactly as many games as their points scoring efforts suggest they should. However, as we know and love as fans, luck plays its part in many an outcome. What we’re seeing here then is that the teams who fall above the line are the lucky teams; that is, the match results fell their way more than they should have. And vice versa, those below represent the unlucky teams that got the wrong end of the stick.
So why is my team declining?
The hypothesis is that luck, good or bad, runs out, and teams who ended up well above or below expectations last year are likely to level out this year. For us to make a bold prediction about 2023, we are considering teams with a gap of 1.5+ wins between expectation and actual in 2022.

Of the teams returning the strongest predictions:
Collingwood finished a massive 4+ wins ahead of expectation, so were not only the luckiest team of 2022, but the 2nd luckiest team of all time. They managed 4th, with 7 of their 16 wins coming by less than a goal - and their points differential was closest to the team who finished 12th - 6 wins behind them. We’re expecting some of these close, coin-toss wins to turn into losses and them to go backwards this year.
Port Adelaide, on the flip side, finished 3 wins behind where they were expected, with a theme of close losses and big wins in their 10-win season. With a points differential better than 4 teams ahead of them - we’re expecting the big wins to remain as wins, and some of the close losses to become wins as well - so they should improve.
Of course, these predictions don’t consider injuries, suspensions, fixture schedules, draftees, or trades so can always be supplemented with additional analysis.
An important note is that this analysis was completed prior to the round 1 results. While we know that 1 data point isn’t enough to draw conclusions, it’s interesting to note that Collingwood actually beat the defending premiers. Overall, of our 5 predictions, 2 performed ‘as expected’, 2 went the opposite way, and there was a draw.
Proof that it works
There were no strong predictions in 2021 - but if we look at the last 5 years, the strongest predictions were the unlucky seasons by Geelong and Brisbane in 2018, who finished in 8th and 15th. In 2019, they were the top 2 sides in the competition and have remained premiership threats ever since.
All time, the only side luckier than Collingwood last year, were South Melbourne in 1936, when they finished 1st with 16 wins; that’s 4.15 above expectation. In 1937 they finished 9th of 12, with only 6 wins.
At the other end, North Melbourne in 2013 were history’s unluckiest team - finishing 10th with 10 wins, nearly 5 wins below expectation. In 2014 they improved to 6th with 14 wins,
Every season, including these two, can be seen plotted in Qlik below. The green dots represent an accurate prediction of the following year’s results, i.e. lucky teams declining and unlucky teams improving; the red dots are where the prediction didn’t come to fruition. As you can see at a glance, the green dots comfortably outweigh the reds.

Historically, the model doesn’t perform quite as well as it does in the NRL, yet still, the strongest predictions (i.e. the type we’re making for Collingwood and Port Adelaide) have come true 85% of the time. We can see that generally, the higher the luck (good or bad), the more accurately this predicts their following year of results.

We’ll see you at the end of the season for a critical self-evaluation!
In the meantime, perhaps we can help uncover some insights with your data?
We specialise in data visualisation at White Box
We can help illuminate your data so that you can make the right, unbiased decisions for your organisation.
As your partner in data visualisation, we’ll help you to realise the full potential of your data and maximise your business success through advanced and innovative solutions that make all the difference.
Get in touch today for your free data strategy consultation.
Analysis details
Data source:
Tech stack:
Python, Qlik
Explore more of our data stories


