What’s New in Tableau 2022.1 – Part 1
Here at White Box, we use Tableau every day as part of our data analysis and processing solutions. Recently, Tableau released a major update with an extensive list of features, each with their own associated benefits.
While this list contains several small and minor changes, we’re going to take you through some of the most relevant features and updates that we’ve noticed are most useful to us.
So, here’s part 1 of our guide to everything you need to know about the latest Tableau 2022.1 update.
Read More
Data visualisation: more than meets the eye
Every business understands that data is the most valuable asset today, as it’s the essential ingredient in drawing out key insights and learnings to make more informed decisions.
When data is presented in a visual medium, such as dashboard tools like Power BI, data can be interpreted more effectively.
However, poorly executed data visualisation will get you nowhere. Here we begin looking at best practices for data visualisation to help you draw the most out of your business’s data.
Read More
How businesses can make sense of abundant data to improve productivity, efficiency, and profitability
With so much data readily available, businesses no longer have to rely solely on instinct and assumptions to make decisions. Instead, smart businesses collect, observe, analyse and make use of all of this data to empower their decision-making.
Read More
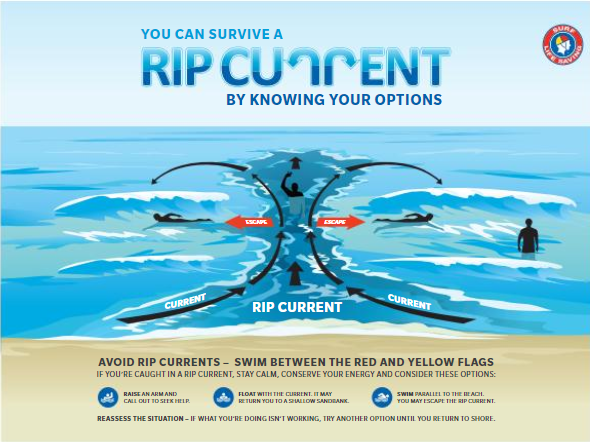
Coastal safety
With the long weekend upon us and a forecast of sunshine, many people will pack a bag and head to the beach. Whilst this is a great idea (and one many of the White Box team will also do), we encourage everyone to be safe and also be thankful for the Surf Life Saving Australia (SLSA), who keep a watchful eye over us.
Read More
How to use interactive image dashboards in Power BI to gain deep business insights
We have successfully applied image interaction into Power BI to enable our client to gather the insights they required in a simple and efficient visual format.
Read More