NRL 2023: Movers and Shakers
Update 26/09/2023
After the end of the 2023 NRL regular season, and with only the grand final to go, it’s time for a final look at our pre-season predictions.
Our Power BI data model has been updated, and we’ve once again focused on our significant picks.
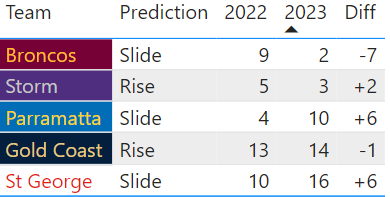
Like the mid-season update, the Broncos continued to make us look silly, moving 7 places in the opposite direction to our prediction. This was buoyed by arguably the signing of the season, Reece Walsh, which was not a factor in our predictions.
In better news, unless you’re an Eels or Dragons fan, we successfully predicted their massive slides, who lost 6 places each, and the 2 place rise of the Storm.
Our other loser was the Titans - we expected improvement but they went backwards a place.
Overall for 2023:
We predicted 60% of movements correctly
Our movements moved a net of 6 places in the direction prediction
We’ll be back in the 2024 pre-season for another iteration!
Update 6/06/2023
After 14 rounds, and about half the 2023 NRL season gone, it’s time to check in with how our predictions are going.
We’ve visualised a table in Power BI, which shows a team’s 2022 final ladder position, their current ladder position in 2023, and how that rates versus our pre-season prediction.

Parramatta and St George have dropped a massive 15 spots on the ladder between them, and we correctly predicted them to slide.
Melbourne and the Gold Coast, our two predicted risers, are exactly where they finished last year. We’ll take that for now.
The Broncos have made us look a little foolish - spending a large chunk of the season at the top and currently sitting 2nd; seven places above last year when we predicted them to go in the opposite direction.
So how would we assess ourselves?
We could say that only 40% of teams moved in the direction that we predicted
We could also say that 80% of teams have moved in the direction we predicted or stayed the same
We could say we’ve predicted a net of 8 places in the right direction, across 5 teams, or 1.6 position movements per team on average correctly
We’ll let you decide how we’re going - but it is important to note that context is critical. The data story could be told in three (or more) different ways - each one reflecting a different level of success, but it’s only when you drill down into the drivers that you see the full picture.
Original Article
After a long off-season, the NRL season is here! What better way to celebrate than by making some bold, data-driven predictions about the biggest movers of the upcoming season.
Let’s jump straight to it – we’re predicting Melbourne and Gold Coast to improve on their 2022 season and St George, Brisbane, and Parramatta to decline.
How we came to that conclusion
The methodology used here is called Pythagorean expectation. While it sounds ancient, it’s actually an approach devised by Bill James of baseball’s Moneyball fame, one of his many statistical innovations.
Put simply, it determines that the primary drivers of a result are points scored and points conceded, and works out how many games a team should have won. For example, if a team scored 500 points and conceded 500 points over the course of a 24-game season, we might expect them to finish with a 12-12 record. A team that goes on to win more than twelve, has gone beyond that expectation - let’s call them ‘lucky’ - meaning a team that wins fewer than twelve are the ‘unlucky’ ones.

In the chart above built in Qlik, we’ve plotted the Expected win % (based on points for and against) against the Actual win % (based on match results) across every season of every team in Australian Rugby League history going back to 1908. Each dot represents a distinct season for each club in the competition.
If this was a perfect prediction, we’d expect to see every dot fall right on the red line, with teams winning exactly as many games as their points scoring efforts suggest they should. However, as we know and love as fans, luck plays its part in many an outcome. What we’re seeing here then is that the teams who fall above the line are the lucky teams; that is, the match results fell their way more than they should have. And vice versa, those below represent the unlucky teams that got the wrong end of the stick.
So why is my team declining?
The hypothesis is that luck, good or bad, runs out, and teams who ended up well above or below expectations last year are likely to level out this year. For us to make a bold prediction about 2023, we are considering teams with a gap of 1.5+ wins between expectation and actual in 2022.

Of the teams returning the strongest predictions:
Melbourne finished more than 2 wins behind their expectation, so were the most unlucky team of 2022. Considering they finished with the most points scored and 4th least points conceded, yet could only manage 5th on the ladder, this makes sense and we’re expecting a resurgent side in 2023.
St George, despite finishing 10th and only 2 wins outside the top 8, exceeded expectations by more than 2 wins, so in bad news for Dragons fans hoping for a push into the finals, we’re predicting them to go backwards this year.
While not quite meeting the significant 1.5 luck threshold, it’s also worth commenting on Penrith. Although they’ve been the clear standout team for the last few years, perhaps they did overachieve slightly last year. With that said, they finished 1st by 2 wins last year, so even declining by 1.4 wins would have them still on top.
Of course, these predictions don’t consider hamstring injuries, suspensions, fixture schedules, or roster movements, so can always be supplemented with additional analysis.
Proof that it works
Looking back to 2021, the strongest predictions were for the Rabbitohs (20 wins) and Knights (12 wins) to decline. True to form data, they leveled out in 2022 with 14 and 6 wins respectively.
All time, the 1995 North Sydney Bears are the unluckiest team – finishing in 8th place with nearly 5 wins below expectation. In 1996 the unlucky streak ended and they corrected to finish 3rd.
On the flip side, the 2007 Cowboys are history’s luckiest team – finishing 3rd with nearly 5 wins above expectation. In 2008 their luck ran out and they dropped off dramatically to finish 15th.
Every season, including these two, can be seen plotted in Qlik below. The green dots represent an accurate prediction of the following year’s results, i.e. lucky teams declining and unlucky teams improving; the red dots are where the prediction didn’t come to fruition. As you can see at a glance, the green dots comfortably outweigh the reds.

Indeed, in the last 20 years, the strongest predictions of ladder movement (teams with a luck rating of 3+) have come true 93% of the time. While there are no such clear contenders for the 2023 season, the teams we’ve made predictions for all fall in the 1.5-3 range; those predictions have come true 83% of the time.

We’ll see you at the end of the season for a critical self-evaluation!
In the meantime, perhaps we can help uncover some insights with your data?
We specialise in data visualisation at White Box
We can help illuminate your data so that you can make the right, unbiased decisions for your organisation.
As your partner in data visualisation, we’ll help you to realise the full potential of your data and maximise your business success through advanced and innovative solutions that make all the difference.
Get in touch today for your free data strategy consultation.
Analysis details
Data source:
The Rugby League Tables & Statistics
Tech stack:
Python, Qlik
Explore more of our data stories


