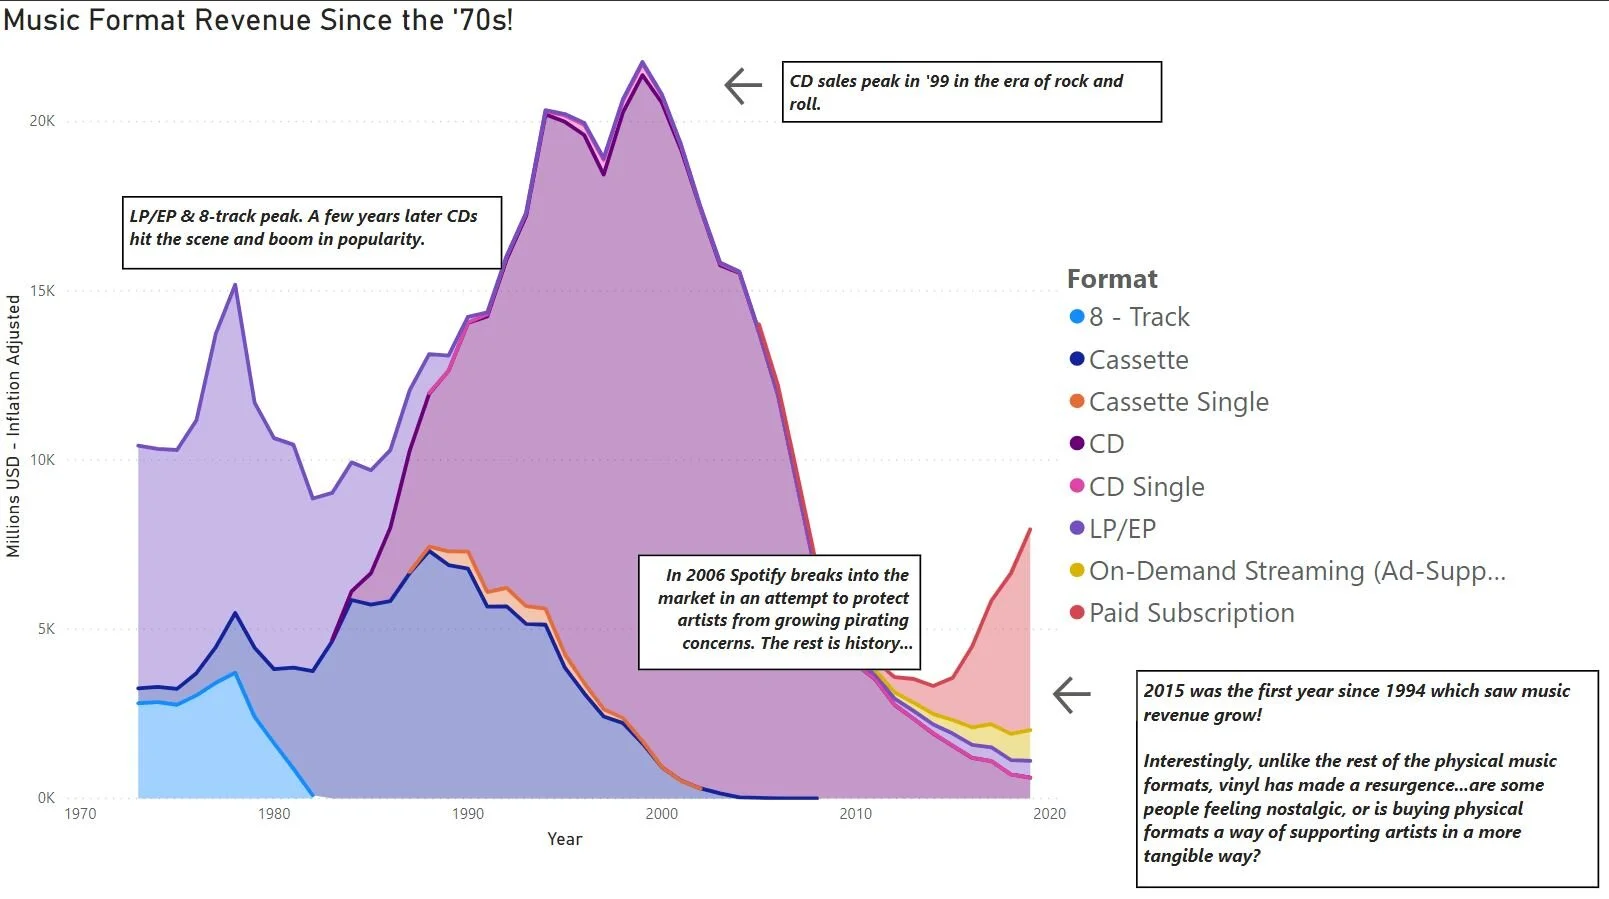
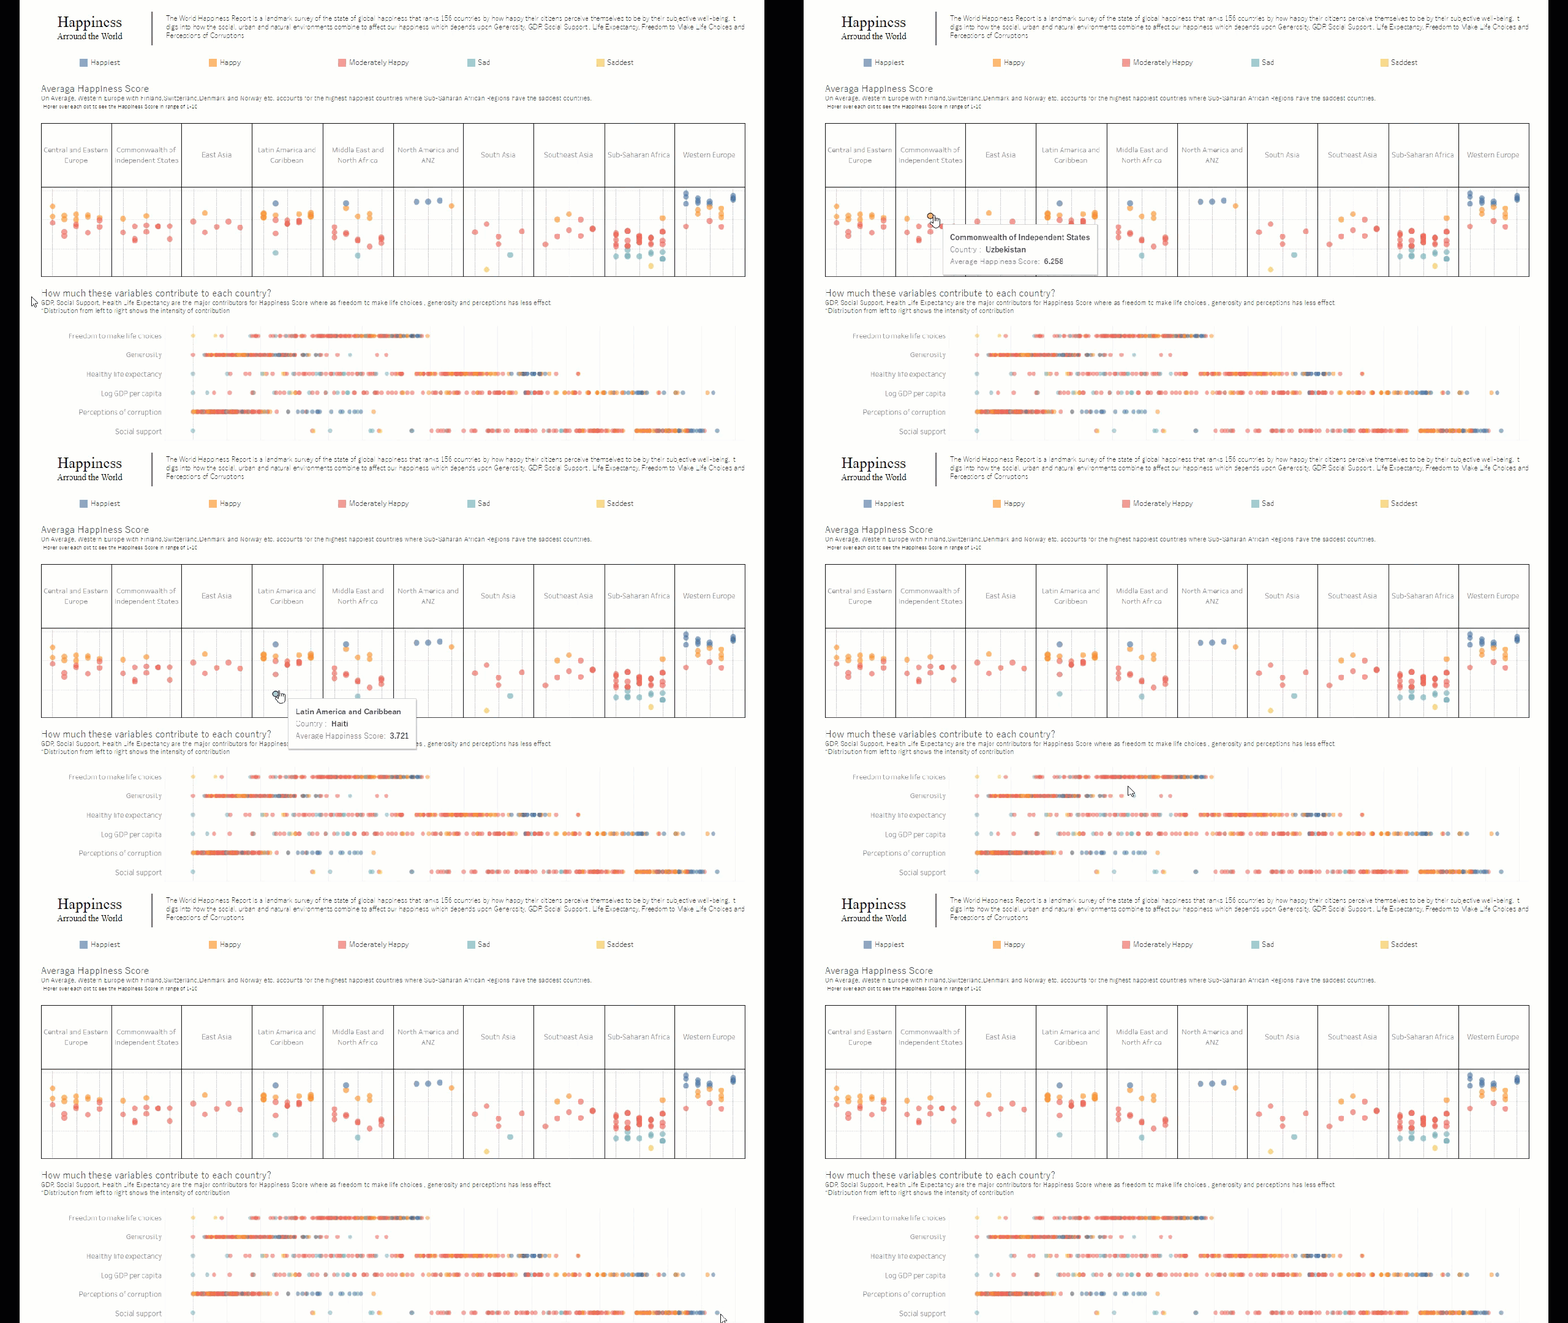
This Power BI visualisation shows music revenues generated by format since the 1970s. Simple expressions like this have powerful story telling abilities when the underlying data is understood and explored in more detail. Get in contact for help on analyzing your own data.
Read MoreThis visualisation showcases the cheapest and most expensive states for both minimum and full coverage car insurance in the US. The data is presented using Power BI which is becoming an increasingly popular tool among all businesses.
Read More


