Our 5 step process
-
We don’t race straight to the data side of things. We want to understand your industry, your business, your team, your day to day, and if it’s ok, you. With that real connection we’re in position to truly understand your needs, collaboratively flesh out your objectives and identify the visual solutions that will achieve them.
If you’re invested in a particular reporting platform, whether Power BI, Tableau, Qlik, Looker Studio or something else, we’ll factor that into the equation.
Being adaptable to different industries is one of our important competencies. But if someone tells you “data is data” without trying to deeply understand your business, be wary.
-
This could involve some serious getting of the house in order. In that case we provide strategic guidance to transform potentially messy or disparate data sources into whatever suits your objectives, ranging from a usable foundation through to a fully scalable solution.
Whether in need of the above or not (you may be one of the few with a sleek data warehousing setup in place), we then take the time to wireframe the end product and understand the implementation plans, all to ensure your vision and end use is encapsulated in the approach to development.
-
If we’ve done the first two steps right, this is the easy part.
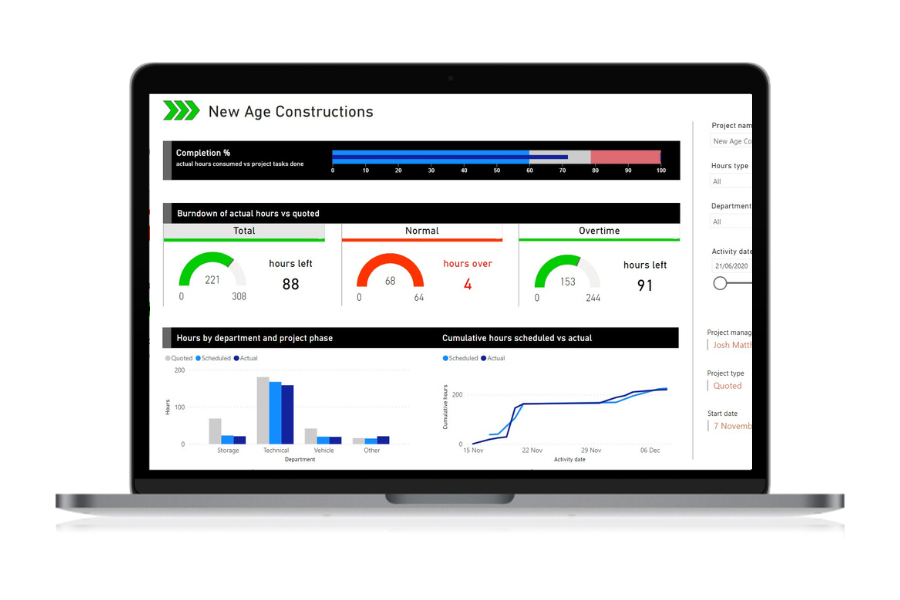
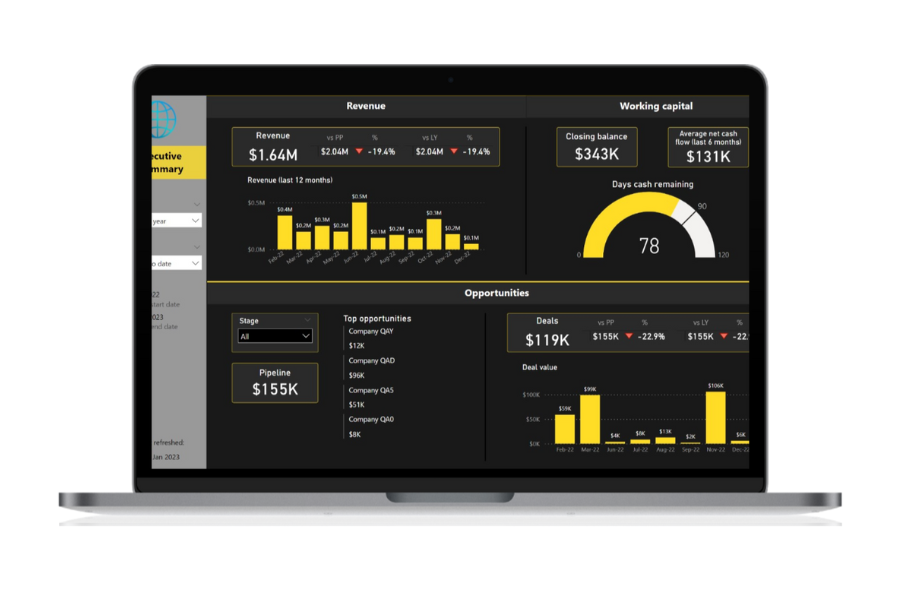
With our guiding lights of clear objectives, clean data, and design wireframes, the build phase of the dashboard starts on a rock solid base. We also draw on a number of internally developed ready-to-go components that mean your dashboard functionality gets off to a fast start.
Branding guidelines would also be provided on commencement of this stage so you immediately begin to see results that reflect your business’s personality.
-
Often this stage is referred to as ‘delivery’, and it has a ring of finality to it that we believe is misleading. A mere handover isn’t enough - we ensure that the deliverables are ingested into the business, with user training, documentation, and support for stakeholder buy-in.
At a practical level, we recommend a soft launch phase of up to 7 days of user acceptance testing to ensure the dashboard measures up to the rigours of operational use. After any final tweaks, we deploy to production so you can start living every day better.
-
More than 80% of data projects are said to fall away or fail completely, with post-deployment problems a leading cause. An unexpected technical challenge after the consultants have done their initial work can test people’s resolve to adopt new data initiatives.
By working with you over a longer timeframe these issues can be navigated, and we can keep you across new developments in Power BI, Tableau, etc when they happen. We offer support and continuous learning to help you evolve your data capabilities, building stakeholder confidence and engraining your new business intelligence in the company mindset.
This means we are proactive, and accountable for the solutions we help deliver.


Want to know more about the different visualisation packages? Head to our Everything you need to know page.
Read our customer success stories
At White Box we have helped hundreds of clients make better use of their data - from impactful dashboards to machine learning algorithms that predict churn.
These showcase our expertise in Power BI, Tableau, Qlik and Looker Studio as well as our deep understanding of SQL, R and Python.
Catch up with our data stories
At White Box, we’re passionate about data analysis & visualisation and we like to showcase this through our Data Stories.
Our blog posts cover diverse topics but all have data analysis and visualisation as the backbone to the thoughts and insights we uncover.


