Customer segmentation
Overview
The Fitness and Lifestyle Group (FLG) own 10+ brands including Fitness First, Goodlife and Zap across Australia, New Zealand, Vietnam, Thailand and Singapore, each with it’s own data infrastructure including payment systems (a complex data environment!).
With so many brands and ways of working, the FLG board were essentially blind to their own market share; where they were doing well and where the biggest opportunities lie.
A segmentation across all brands would illuminate their own perspective and bring instant value from their sizable data asset.
The problem
Although the brands operate independently, the FLG board required a holistic view of all of their customers, to make strategic decisions.
They wanted to identify the key customer segments across the group so the brands could cater to different parts of the market, in different locations, with unique products and varied pricing models to retain the highest value customers now and in the future.
The data was rich and vast, with transactional data describing every member action over the last 20 years, even down to app usage for the newer digital brands.
How could we bring together that many brands and data sources to create a simple, easy to understand segmentation?
The solution

We set up workshop sessions with key stakeholders across the business to understand the main pain points and unanswered questions, which gave us a focus for initial insights and data discovery.
Part of this process incorporated the assessment and audit of the data to understand what was consistent and robust enough to reliably be used across all brands.
Quick win insights not only provided relief to burning questions but also aligned our data knowledge to focus on the bigger puzzle; building the holistic segmentation.

The Single Customer View was the backbone of the analysis, which incorporated as many of the robust variables across all brands as possible.
Once we had our data analysis table, we used Hierarchical clustering to guide us on the number of clusters and K-Means to perform the analysis.
This is an iterative process with a degree of subjectivity for what works for the business as well as being statistically valid.
The results
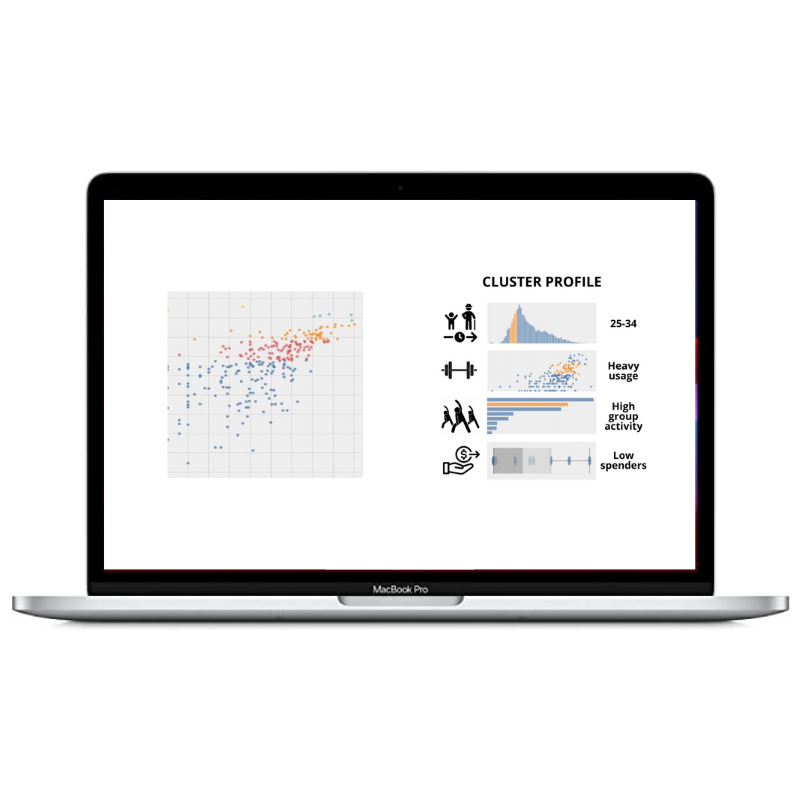
The final solution consisted of 5 key customer segments that encompassed the large variability of gym goers but was still tactical enough to provide insights at a brand level.

Example of Pen Portrait for illustrative purposes only
Pen portraits were built to describe the segments on a single page and the solution implemented within their Snowflake environment for a daily refresh.
What did this provide?
A better understanding of their customers
Improved brand and product differentiation
More targeted use of resources
Organisational focus on high value customers
Reduced marketing wastage
Improved formula for new brand acquisitions
Better digital and physical products
Unified customer service approach
Empowered sales teams with market leading insights
The segments are now a key measurement for the board but also used in digital life cycle comms and acquisition strategies.
Want to know how your business could implement a similar solution? Contact us now to find out more.
Read more customer success stories