Data science driven insights
Overview
A large media company had the aim to be best in class with regards to their customer contact strategy, identifying the right channel through which to contact a customer is crucial. They wanted guidance on how they can grow and evolve each contact channel, with customer cohesion in mind.
How could they identify when to use each channel, which messages or which customers are best targeted using a direct vs indirect contact method?
Can they understand the principles of each channel to provide a framework as to how and when they should be used, direct channels can be invasive so are messages worthy of their use?
Can overuse erode customer engagement?
This client wished to understand the content that drives engagement, messages that warrant a single send approach vs multi-content emails.
Does repeating a campaign or a theme across communications reinforce the message?
Which vehicle is best for which message and customer?
What should the contact hierarchy be and how frequently should customers be contacted?
The problem
Previous analysis looked at the impact of frequency using a subset of engagement data.
They wished to widen the timeframe, to investigate the following points using email engagement data for a 2 year period with the objectives:
• Investigate the influence of email frequency over the last 2 years
• Are the same customers repeat engagers? Are there common trends in engagement behaviour?
• There was no correlation during the initial analysis to identify that frequency increased unsubscribes.
How many email campaigns do customers receive before they unsubscribe?
Are certain campaigns more likely to provoke an unsubscribe?
• Recommend a frequency test plan and communication hierarchy to optimalise email frequency and mix for increasing engagement but keeping unsubscribes to a minimum.
The solution

Why use regression modelling?
Regression modelling is used to estimate the relationship between an event e.g. unsubscribing and other variables (how many emails you have received in a month).
Although often used to predict an event, we can use the relationship equation to help us understand the drivers of the event.
Why Logistic regression?
Our target variable is binary, therefore either Yes or No e.g. did the customer unsubscribe?
How did we build it?
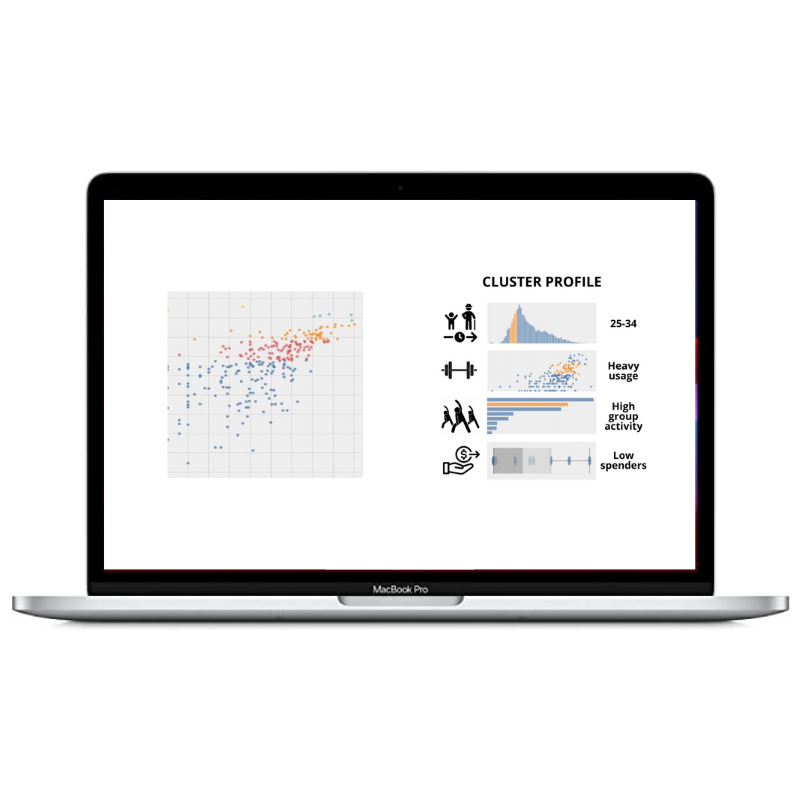
We created a Single Customer View and built features (variables) that help describe the customers experience of receiving emails e.g. how long have they been receiving emails, how many overall/in a month, how engaged are they etc.
Missing values can be hazardous to any analysis, especially modelling. For this project, we were able to update missing values using 0, since a missing value represented no email was sent.

Correlation analysis output
We then ran correlation analysis with the aim of reducing the number of variables. This is a critical step, often overlooked as many Machine/Deep Learning solutions contain so many variables. However, simplification should always be the aim.
Normalisation
Given the sheer volume of customers and emails sent, there will always be skew/outliers e.g. customers who have received an extreme amount of emails or have engaged with everything. Although potentially valid, we don’t want these to skew results so we “normalise” the variables.
For ease of interpretation, each feature was transformed into quintiles e.g. 5 equal groups. These can be thought of as Very Low, Low, Medium, High and Very High.
We then split the data into Train and Test subsets of data, allowing us to test and validate different features and models. Modelling is an iterative process of test-review-modify and repeat.
The results
There are many outputs and uses of a model but ours was to gain a deeper understanding of the relationship using the output coefficients.
The coefficients provide a measure of “impact” each feature has on successfully predicting the outcome. These can be positive or negative e.g. doing more of a negative thing will reduce the likely outcome.
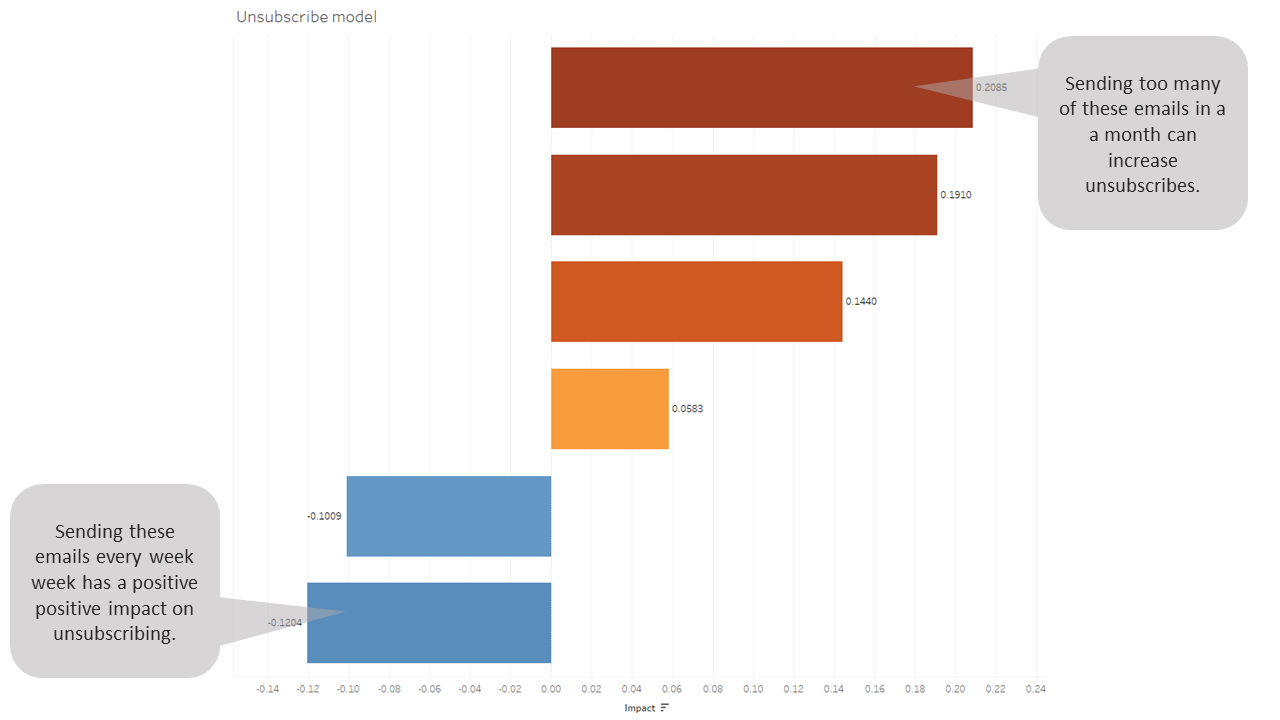
This is an easy (hopefully) to understand output that gives direction on what is working and what is not in terms of unsubscribing.
We combined the findings from two models (unsubscribe and high engagement) along with a wealth of other insights derived from the analysis and the Single Customer View build to provide the recommendations for our client.
These are the building blocks for test & learn and not the final strategy. Only by testing and evolving the ideas here, can the client be certain that the insights are tactically useful. With any data analysis and modelling, we are only viewing the data lens of the problem, when in fact there are many more dimensions to why someone will engage or unsubscribe.
Want to know how your business could implement a similar solution? Contact us now to find out more.
Read more customer success stories